
Analytics Pro Dashboard
Opening the dashboard#
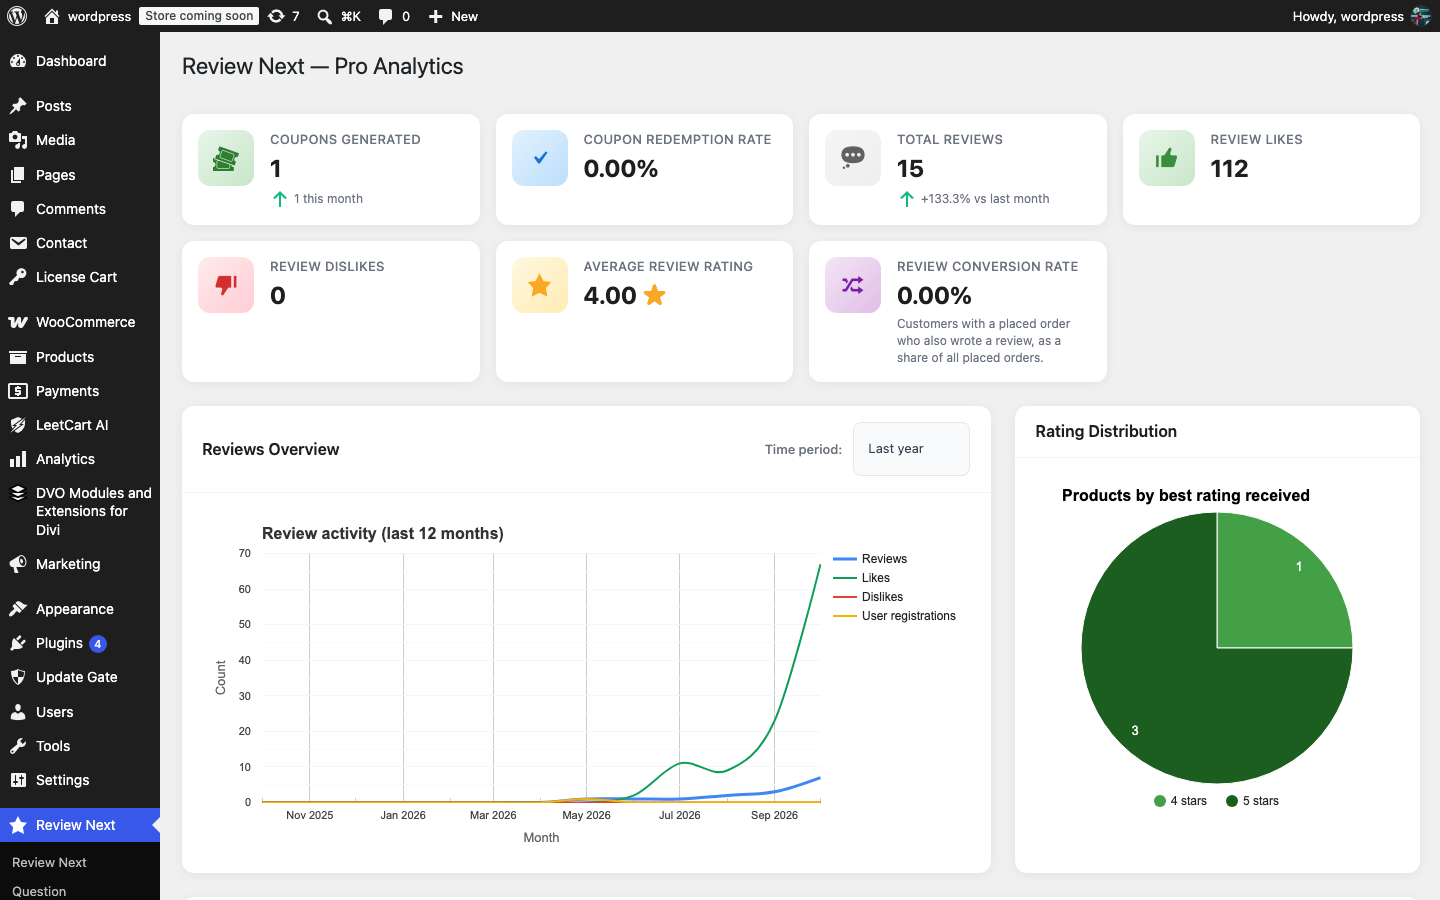
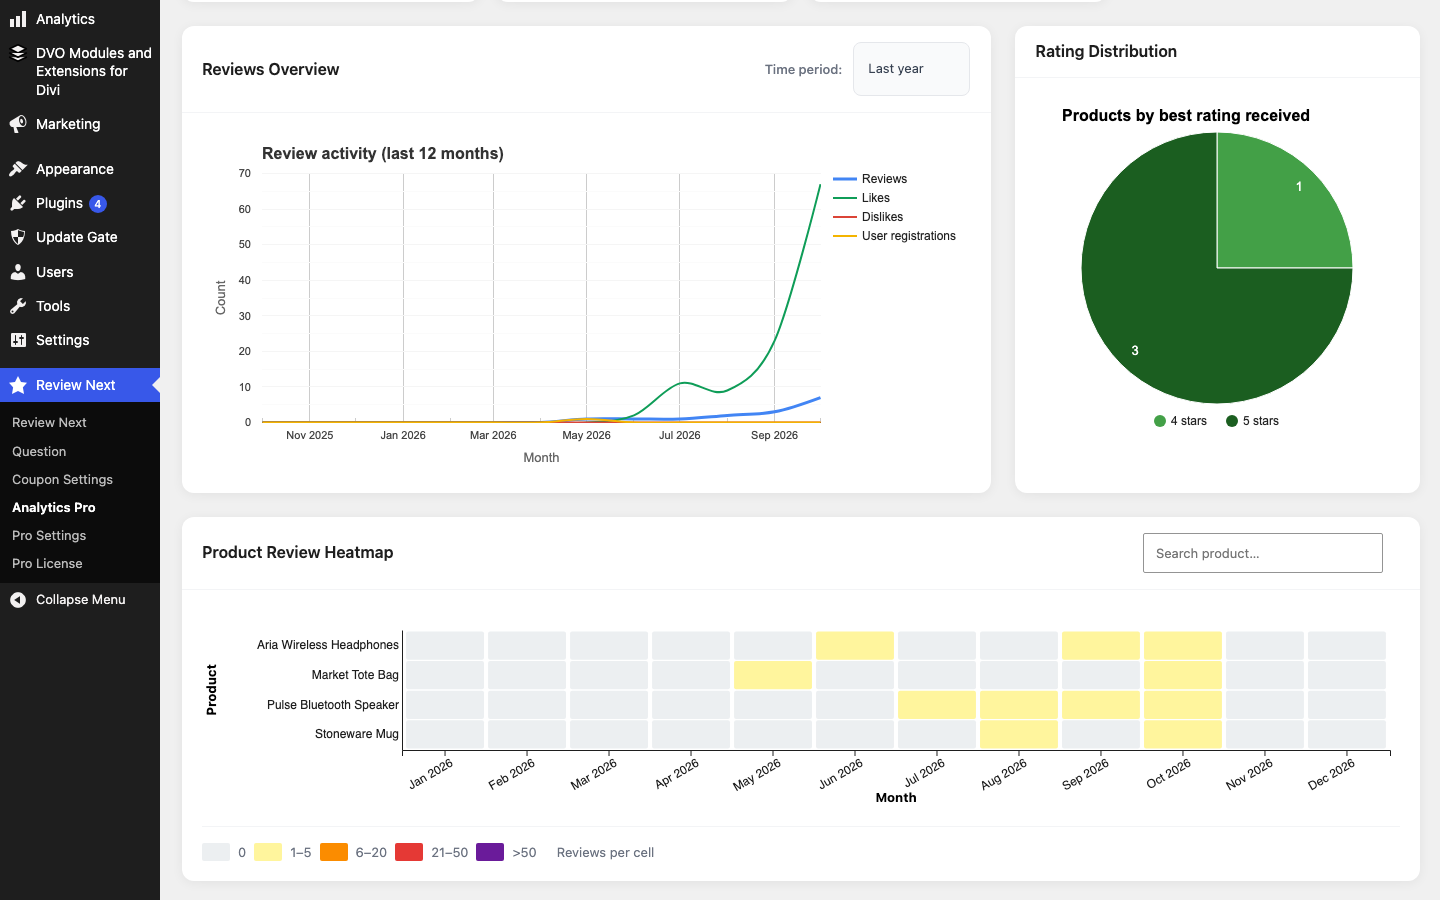
Go to Review Dashboard > Analytics Pro. The page is available to administrators (the manage_options capability). If the license is not active, the page shows Analytics unlocks as soon as your Pro license is active with an Activate your Pro License button instead.
The free plugin has a simpler Analytics tab of its own. Pro keeps that tab untouched and adds this separate, more detailed page.
Stat cards#
The top row shows one card per metric. Two of the cards carry a month-over-month trend comparing the current calendar month with the previous one (in your site’s timezone): an up or down arrow with a percentage such as +12.5% vs last month. When last month had no items, the card shows a plain count such as 3 this month instead of a percentage.
| Card | What it counts | Trend |
|---|---|---|
| Coupons Generated | Published WooCommerce coupons on the site (shop_coupon posts). On a store where coupons come from the free plugin’s review rewards, this is the number of review coupons created. | Yes: coupons created this month vs last month |
| Coupon Redemption Rate | Share of published coupons that have been used at least once (usage count above 0), as a percentage. | – |
| Total Reviews | Approved product reviews. | Yes: reviews written this month vs last month |
| Review Likes | Sum of all “helpful” likes across reviews. | – |
| Review Dislikes | Sum of all dislikes across reviews. | – |
| Average Review Rating | Average star rating of all approved reviews, to two decimals. | – |
| Review Conversion Rate | Customers with a placed order (completed, processing or on hold) who also wrote an approved review, as a share of all placed orders. Works with both HPOS and posts order storage. | – |
| Questions & Replies | Number of customer questions and store replies from the free plugin’s Q&A feature. Shown only when the Q&A table exists. | – |
How to act on the cards#
- A falling Total Reviews trend with stable sales usually means the review request is not reaching customers: check the free plugin’s email settings.
- A low Coupon Redemption Rate suggests the reward is not attractive enough or expires too soon; adjust the coupon settings in the free plugin.
- Many Dislikes on reviews can point to unhelpful or off-topic reviews worth moderating.
- A low Review Conversion Rate means most buyers never review; a review reward or a follow-up email usually moves it.
Reviews Overview chart#
A line chart with a Time period selector:
| Period | Granularity | Series shown |
|---|---|---|
| Last 30 days | Per day | Reviews |
| Last 6 months | Per month | Reviews, Likes, Dislikes, User registrations |
| Last year (default) | Per month | Reviews, Likes, Dislikes, User registrations |
Reviews are counted by the date they were written. Likes and dislikes are summed by the month of the review they belong to. User registrations are new WordPress user accounts, which is useful for comparing review activity with customer growth.
The daily (Last 30 days) view only plots reviews. Likes, dislikes and registrations are shown on the monthly views.
Rating Distribution pie#
Groups every published product by the best rating it has received: 5 stars, 4 stars, down to 1 star, plus a Not reviewed slice for products that have no approved review yet. Hover a slice to see the number of products in it. A large “Not reviewed” slice tells you which part of your catalogue still has no social proof.
Product Review Heatmap#
A grid of products (rows) by month of the current calendar year (columns). Darker cells mean more approved reviews in that month; the legend under the grid explains the colour scale (Reviews per cell).
- Search product… filters the rows by product name as you type.
- The grid shows 15 products per page, with Previous / Next buttons and a Page X of Y label.
- Hover a cell to see the product name, ID, month and review count.
Use the heatmap to spot products that stopped receiving reviews, or seasonal products whose reviews cluster in a few months.
Caching and freshness#
All dashboard numbers are cached for one hour so the page stays fast on large stores. The cache is flushed automatically whenever a review is added, approved, unapproved, spammed or deleted, so after moderating reviews the dashboard is current on the next load. Coupon and order figures refresh when the hourly cache expires.
External libraries#
The charts are drawn with Google Charts (line and pie) and D3 (heatmap), loaded in the administrator’s browser from gstatic.com and d3js.org. If either library cannot load, the page shows a message such as Google Charts could not be loaded. Check that this browser can reach gstatic.com. Nothing from these services runs on your storefront.